library(tidyverse)Introduction
Here are some examples of how to format axes and axes labels in ggplot2.
Preparing the data
Load required libraries:
Generate cell viability and viable cell density data:
df <- tibble(
  day = 1:7,
  viability = c(99, 88, 77, 66, 55, 45, 35) * 0.01,
  vcd = c(4, 7, 12, 15, 18, 14, 11)
  )
df$day <- factor(df$day)
Adding percentages to y-axis labels
ggplot(df, aes(day, viability)) +
  geom_col(color = "gray") +
  theme_classic(base_size = 20) +
  labs(x = "Time (days)",
       y = "Viability") +
  scale_y_continuous(limits = c(0, 1.001),
                     n.breaks = 10,
                     labels = scales::label_percent(),
                     expand = expansion(0))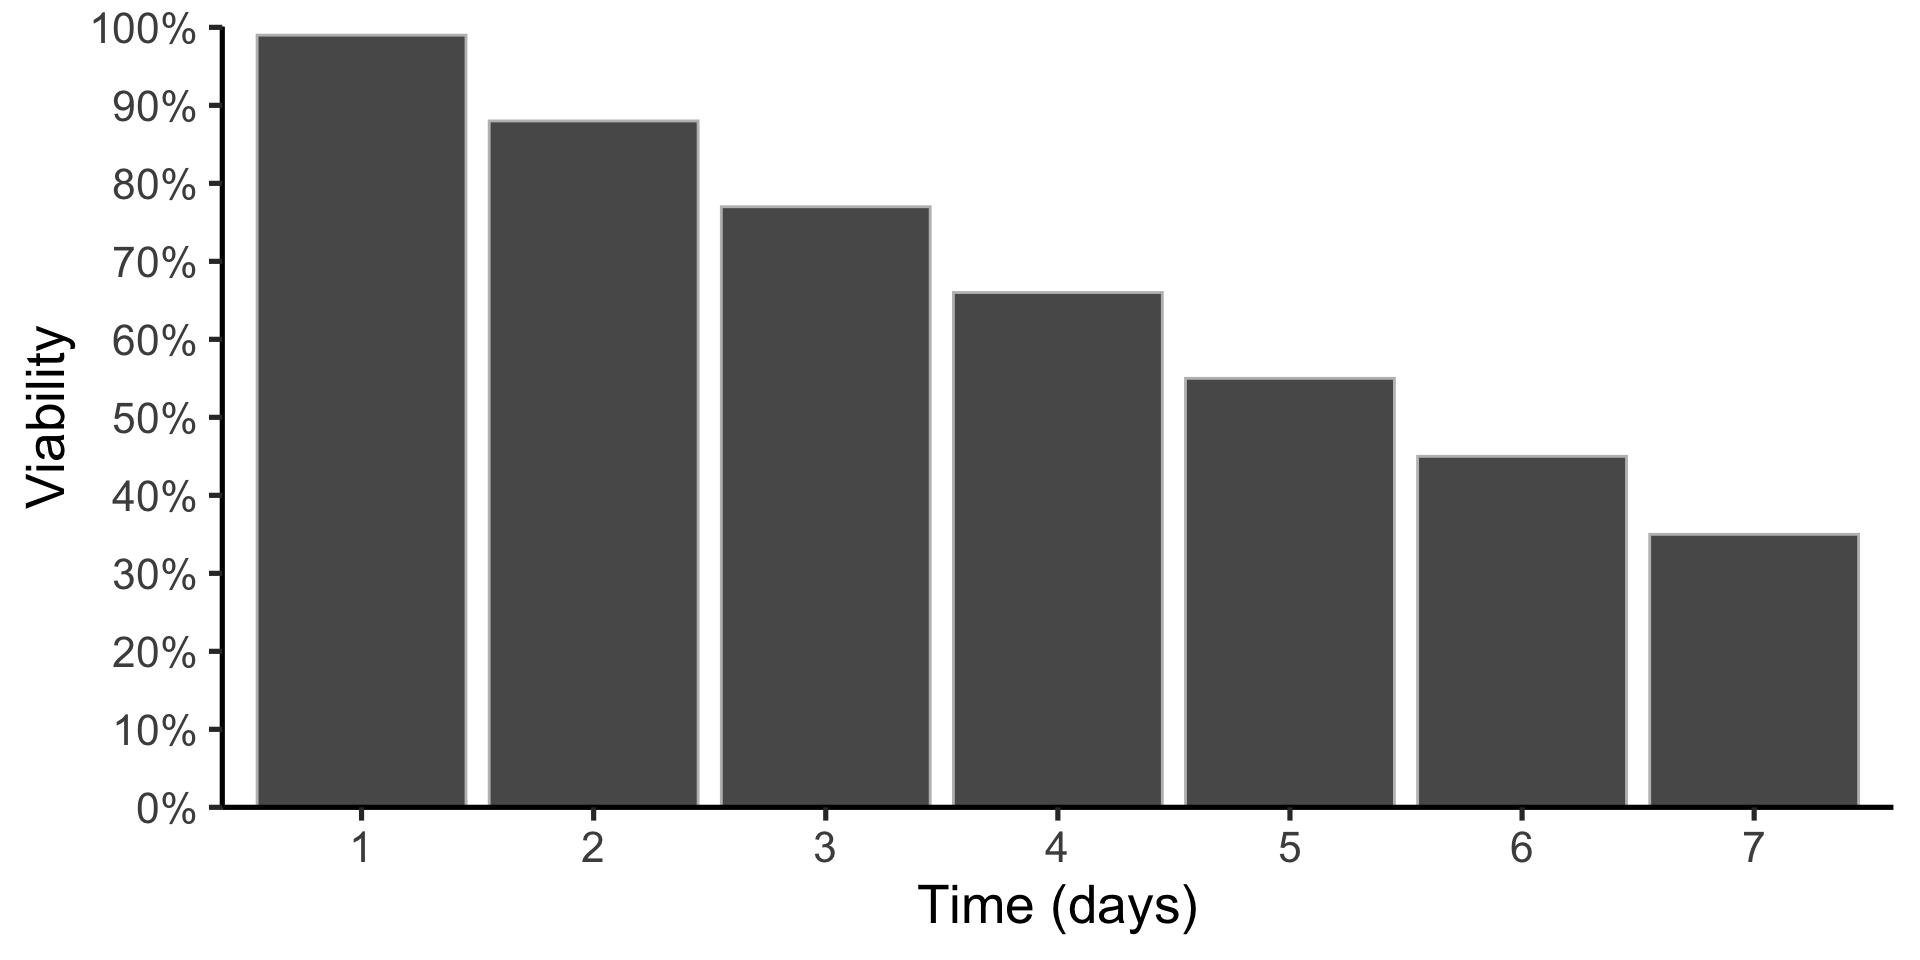
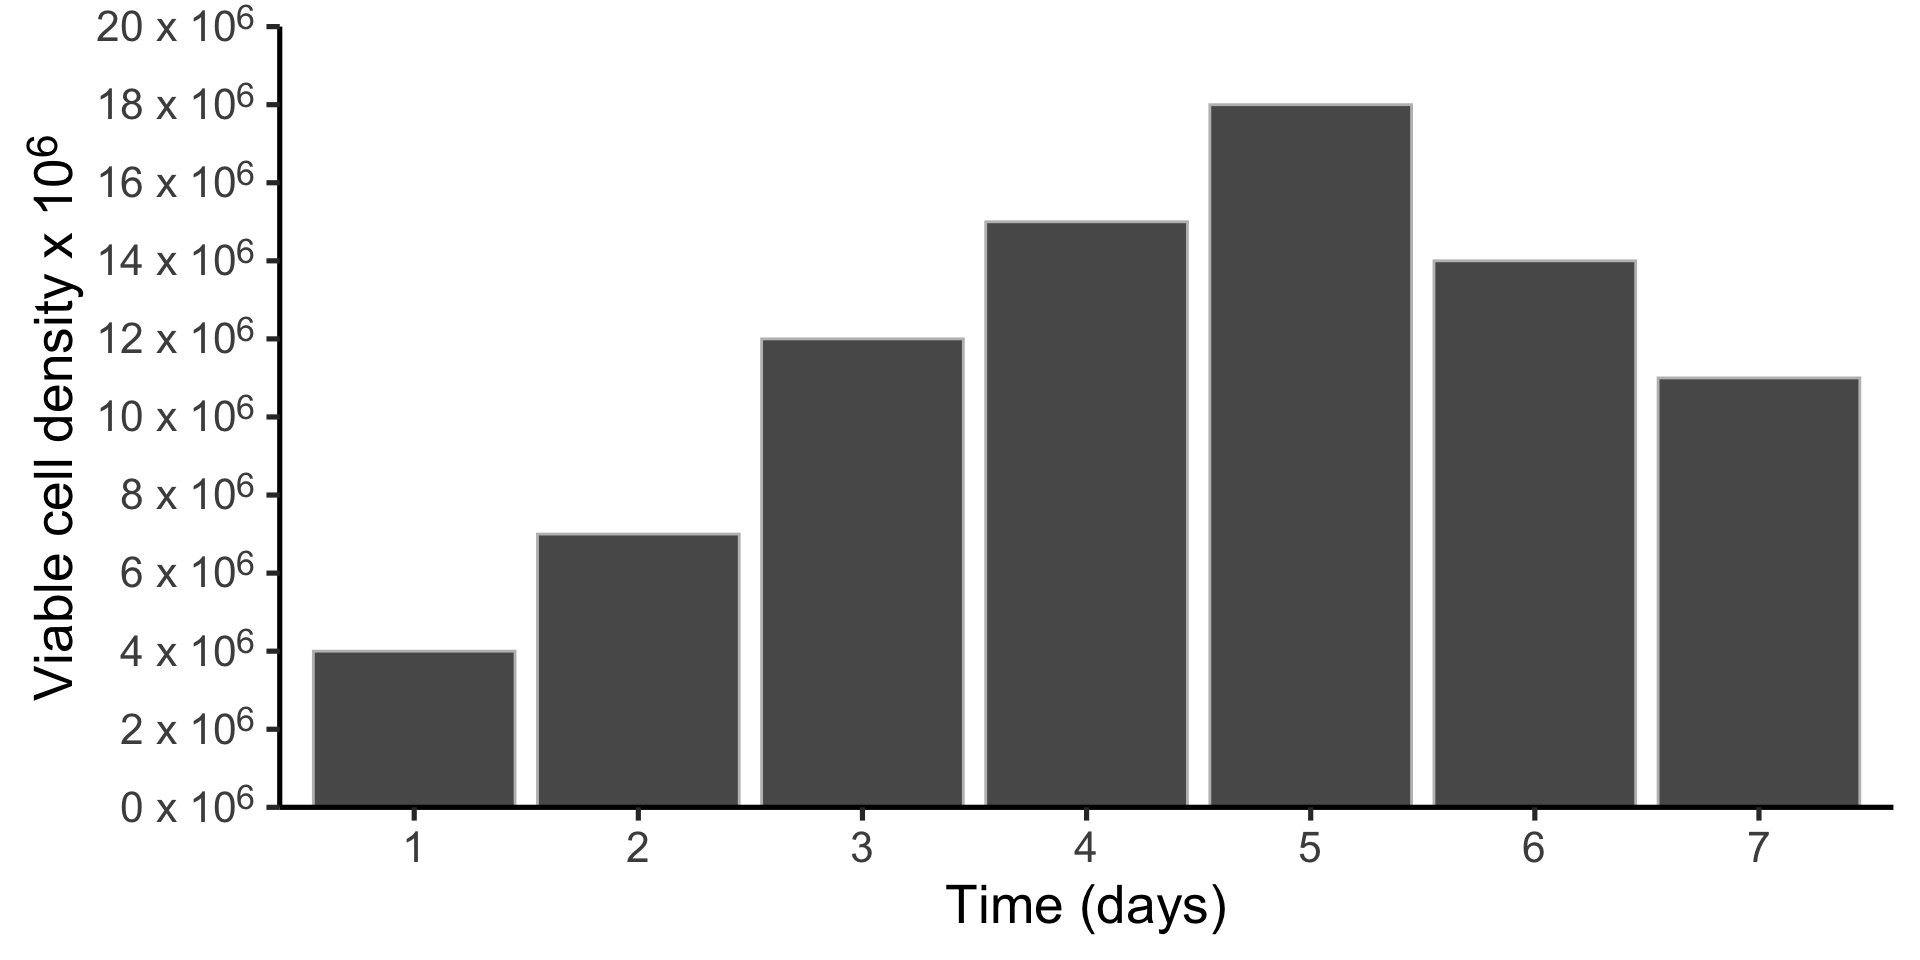
Adding custom suffixes to y-axis labels
ggplot(df, aes(day, vcd)) +
  geom_col(color = "gray") +
  theme_classic(base_size = 20) +
  labs(x = "Time (days)",
       y = "Viable cell density x 10^6^") +
  scale_y_continuous(limits = c(0, 20.001),
                     n.breaks = 10,
                     labels = scales::label_number(suffix = " x 10^6^"),
                     expand = expansion(0)) +
  theme(axis.text.y = ggtext::element_markdown(),
        axis.title.y = ggtext::element_markdown())